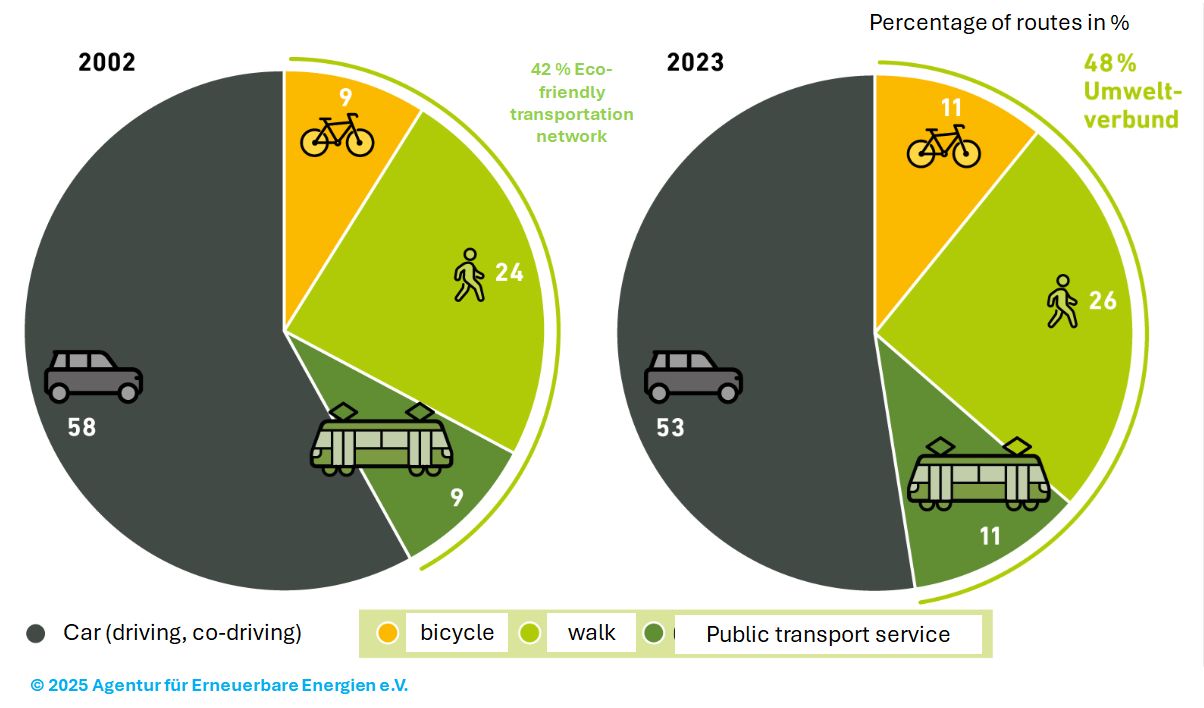
The mobility transition essentially aims to achieve a more sustainable future by shifting as much motorized private transportation (MPT) as possible toward climate-neutral, inclusive, clean, and safer eco-friendly transportation options (public transit, walking, cycling, and car-sharing). This means changing the “modal mix” (i.e., the distribution of passenger mobility across different modes of transportation).
The quality of public transit services is influenced by a variety of factors, such as punctuality, comfort, safety, accessibility, reliability, cleanliness, privacy, prices, and accessibility. Since “qualitative” factors such as the sense of safety, privacy, or comfort are highly subjective, they are determined and compared through passenger surveys, while “quantitative” factors such as fares, punctuality, and accessibility—as well as travel times from A to B—are determined using software-based calculations, thereby making them comparable. This is particularly true when compared to private motorized transport.
For several years now, there have been numerous efforts to measure the quality of public transit and thereby enable its evaluation. Virtually all studies published to date have focused on geographical distinctions. Quality is usually determined in the form of key metrics, which are then depicted in gradations on maps of the area under consideration using differently colored “tiles” (squares, hexagons, etc.).
In this context, a variety of aspects underlying the studies must be distinguished. Factors such as geographic units, settlement-specific distinctions, comparative metrics for public transit and motorized private transportation, modal split, accessibility of public transit, target group categories, destination categories, and others play a role here. And depending on the aspect, different metrics and different results are determined.
A word on the term “quality of public transit service”: As a rule, only quantitatively measurable factors for which generally accessible data is available are considered here. Issues such as the sense of safety on trains, accessibility, reliability, and the cleanliness of transit vehicles, etc., are assessed and published by various institutions through passenger surveys.
The measurement of service quality is based on the fundamental principle that “You cannot improve what you cannot measure.” However, since the existing concepts have been developed by various stakeholders, they are based on different aspects—namely, those that are most important to the respective stakeholder. Broadly speaking, on the one hand, there are, for example, one-time statistics on service quality or changes over time; on the other hand, there are tools that can be used to calculate and geographically map service quality for a user-defined area at any time. Often, the focus is on the geographic accessibility of public transit, but in contrast, it may also be on travel times to predetermined destinations, based on schedules or on route calculations from A to B. Furthermore, analyses may focus solely on public transit, or they may compare public transit with private motorized transport; alternatively, travel times by foot, bicycle, public transit, or car may be determined from the outset and displayed in a dashboard.
Previous publications on the topic of public transit service quality take the form of a wide variety of studies: For example, there are tools that calculate, evaluate, and map service quality for select regions of Germany. However, there are also statistical surveys that were conducted once for a specific institution and provide a “snapshot” of service quality in a given year. Furthermore, there are various evaluation indicators that, for example, assess the accessibility of specific, definable destinations using a school-grade system and display the results as differently colored tiles on a map, or calculate ratios of public transit travel times compared to private motorized transport based on actual connections between a departure point and a destination, among other methods.
In the blog posts on this website, we aim to provide an overview of and discuss the key features of a wide range of such analyses. Each post will include a detailed explanation of the commissioning institution, the data and methodology used in the analysis, and examples of the results.